Simple Plotter
Description
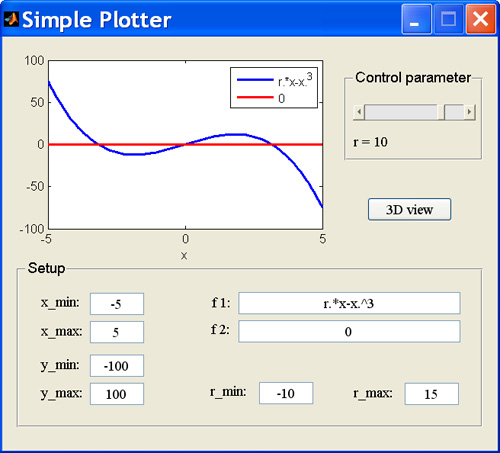
This MATLAB GUI provides a simple way of visualizing bifurcation diagrams by plotting functions that depend on a single control parameter. One of the functions could for instance be the right-hand side of the normal form of a standard codimension-one bifurcation, and the second function could be equal to zero.
Each function should be defined using MATLAB notation. The independent variable should be entered as x, and the control parameter as r.
The 3D button shows the graph of the two functions in three dimensions. If f1 is the right-hand-side of a normal form and f2 is zero, viewing the graph from above gives a representation of the bifurcation diagram, where the colors correspond to growth or decay.
How to use the GUI
Use the "Setup" panel to define the two functions to be plotted, as well as upper and lower limits for the x-, y-, and r-axes.
Use the slider in the Control parameter panel to change the value of r and see how it affects the graphs of the two functions.
Download
To download the GUI, right click on each of the links below, and save the corresponding files into a directory. Set the MATLAB path to that directory and then type Plotter at the MATLAB prompt.
Type help Plotter at the MATLAB prompt if you need to be reminded of how to use the GUI.
GUI developed by Joceline Lega, Spring 2006 and Fall 2008.