|
|
Poiseuille's Law: Graph Exploration of Viscosity
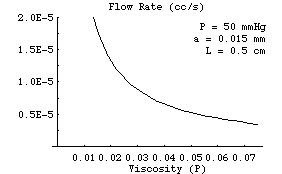
Now we show the graph of the
inversely proportional relation between flow and viscosity. The shape of this graph is called a hyperbola. Notice that as the viscosity gets larger (moving to the right), the value of the flow becomes smaller. If the viscosity gets arbitrarily large, then the flow vanishes. This is referred to as a horizontal asymptote of Q=0. Also, as the viscosity gets smaller the flow increases without bound (in the graph). This corresponds to a vertical asymptote at n=0. However, this does not mean that the physical situation can actually sustain arbitrarily large flow. When the viscosity becomes too small, then turbulence begins and the model no longer applies.
|
