Rosenzweig-MacArthur models

Now we can look at phase portraits for these equations to understand their dynamics. In these pictures, we plot not just a single orbit, but a large number of them.

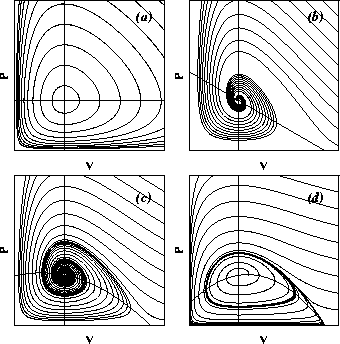
These are the phase portraits for the models we have considered so far. The density, V, of the prey species is plotted on the horizontal axis, that of its predator, P, on the vertical. The direction of motion is in all cases counterclockwise. (a) The Lotka-Volterra dynamics possess a continuum of periodic orbits. (b) With intraspecific competition, the dynamics have only a single, attracting equilibrium, with damped oscillations relaxing to it. The Rosenzweig-MacArthur model can have a steady state attractor (c) or a limit cycle attractor (d). As before, the steady state attractor corresponds to damped oscillations and ultimately a stable equilibrium population size. The limit cycle, on the other hand, corresponds to sustained oscillations, something like what we see in fluctuating populations.
The implications for population cycles would seem to be clear: Rosenzweig-MacArthur models can have sustained oscillations. Might the observed cyclic fluctuations of boreal mammal populations be due to this sort of interaction? Several scientists have attempted to fit models of this sort to the data, with little success. The difficulty seems to be that the range of parameters over which cycles of the correct period exist is too narrow to explain such a robust phenomenon. As we will see, this difficulty is related to another oversimplification common to all of the above models.
M & B Home | Previous | Top | Next